CORONA VIRUS !!! The corona virus case began in Wuhan China since December 2019 AD.Later on it spread to other countries like Korea, America, Italy, Iran, Japan, India including most of the Asian and European countries of the world. WHO named it a Pandemic disease as it appeared in almost all continents of the world. Several countries went in lock down including China, India, Russia, Nepal etc. China and Italy had highest death rate. It was found that, this virus effects the respiratory tract. The symptoms includes: Running nose, Fever, Shortness of breathe leading to pneumonia The death rate was highest among aged people above 80 years old. However it affects almost all age groups. Viral disease has no cure rather than improving immunity.So, take care of yourself everyone. If anyone gets infected, isolate yourself.Protect yourself and your loved ones.
Posts

Isocline: • There can be number of possible output levels as shown in figure and least cost combination can be found out for these various output levels. (I have described about Least cost combination in next blog) • A line or curve connecting the least cost combinations of inputs for all output levels is known as isocline. Expansion path: • Of many isoclines, the isoclines which is considered to be the most appropriate over a production period is expansion path or scale line • At any particular time only one expansion path is possible Ridgeline: • Ridgeline represents the points of maximum output from each input, given a fixed amount of another input • Beyond the ridge line it is less economic to produce
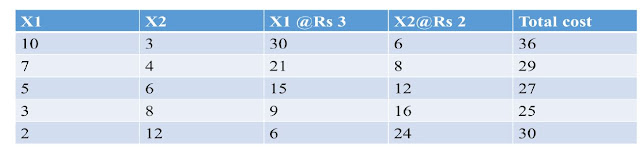
Least cost Combination (LCC) • There are innumerable possible combination of factors which can be used to produce a particular level of output. • The problem is to find out the combination of inputs which should cost least, a cost minimization problem. • There are three methods to find out the least cost combination of inputs. They are: • Arithmetical Method: • Algebraic Method: • Graphic Method: 1. Arithmetical Method: • One possible way to determine the least cost combination is to compute the cost of all possible combinations of inputs and then select one combination with minimum cost. • This method is suitable where only a few combination produce a particular level of output. • The product produced is 100 kg, • Price of x1 input is Rs 3 per unit and price of x2 is Rs 2 per unit 2. Algebraic method: a. Compute marginal rate of technical substitution. • MRS = Number of units of replaced resources/Number of units of added resources. • MRS X1

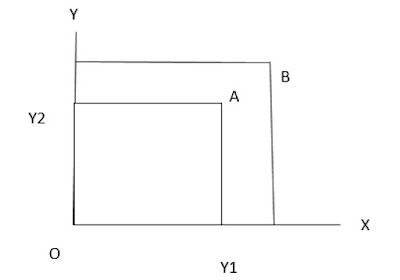
Isocost line • It is also called price line, budget line, iso-outlay line, factor cost line • Isocost line defines all possible combination of two resources which can be purchased with the given outlay of funds Characteristics of Isocost line: • As the outay increases the isocost line moves away from the origin • Isocost line is a straight line because input prices donot change with the quantity purchased • The slope of isocost line represents price ratio. • Where, • Price ratio (x1x2)=Px1/Px2
Types of Product-Product relationship (Enterprise relationship) • Farm commodities bear several relationship to one another. These basic product relationship are: 1. Joint products: • Products that are produced through single production process and the production of one without another is not possible. • These products are obtained in fixed proportions. • If a given quantity of one product is produced, the quantity of other products is fixed by nature. • Joint products are produced through a single production function and for the purpose of analysis they may be treated as single product. • All farm commodities are mostly joint products. • E.g. wheat and straw, groundnut and haulms, cotton seed and lint, cattle and manure, butter and milk etc. where, y1 and y2 are two joint products. • 2. Complementary enterprises: • when change in level of production of one, another also changes in the same direction. i.e. when resource held constant the increase in the leve
Marginal rate of product substitution (MRPS): • MRPS refers to the absolute change in one product associated with a change of one unit in competing product. The quantity of one product to be sacrificed so as to gain another product by one unit in called MRPS. • MRPS= number of units of replaced product/number of units of added product • MRPS Y2Y1= Δ y1/ Δ y2

Production possibility curve (PPC): • PPC represents all possible combination of two products the can be produced with the give amount of input • PPC is also known as opportunity curve because it represents all production possibilities or opportunities available with limited resources • It is called iso-resource curve or iso-factor curve because each output combination in this has the same resource requirement • The amount of land used to produce Maize (Y2) depends upon the amount of land used to produce wheat (Y1). • Therefore, Y1=f (Y2).The allocation of land resource between the two products and the output from different doses of land input are presented below: • Input=5 acres of land As evident from above data, if all 5 acres of land are used in the production of y2 we obtain 60 quintals of y2 and do not get any y1. On other hand, If all the five acres of land are used in the production of y1 we can obtain 30 quintals of y1 and do not get any y2. But these ar