Production possibility curve (PPC):
•PPC represents all
possible combination of two products the can be produced with the give amount
of input
•PPC is also known as
opportunity curve because it represents all production possibilities or
opportunities available with limited resources
•It is called
iso-resource curve or iso-factor curve because each output combination in this
has the same resource requirement
•The amount of land
used to produce Maize (Y2) depends upon the amount of land used to produce
wheat (Y1).
•Therefore, Y1=f
(Y2).The allocation of land resource between the two products and the output
from different doses of land input are presented below:
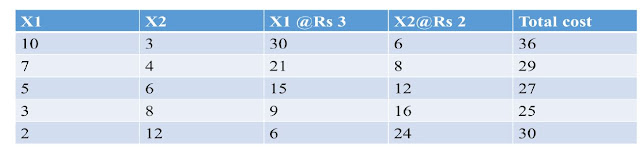
•Input=5
acres of land

As evident from above data, if all 5 acres of land are used in the production of y2 we obtain 60 quintals of y2 and do not get any y1. On other hand, If all the five acres of land are used in the production of y1 we can obtain 30 quintals of y1 and do not get any y2. But these are the two extremes production possibilities. In between these two, there will be many other production possibilities.
•Plotting
these points on a graph, we get the production possibility curve.

Figure: Production possibility curve of 5 acre of land
where, y1= wheat and y2=maize.
Comments
Post a Comment